The AMG Kernel dashboard originates, filters, and trains structured inferences of changing values and sentiment with trusted market data:
Templates derive asset and price data submitted to the SEC EDGAR database of regulated filings that generate interactive dashboard visualizations using ad hoc cloud data services and software visualization solutions.
The Concept prototype features demonstrate how data and visualization services, like AWS and Tableau software, are cloud-based examples used to visualize market sentiment data for non-fundamental (don't use earnings metrics) market data vectors of changing values. The kernel visualizes retail and professional capital market demand for cash and securitized assets.
The interface facilitates interactive analytics of EDGAR filing data accessed at SEC.gov; residing in cloud buckets, for the two open-end capital asset vectors where changing sentiment is commonly understood:
s3://valuevector1 - Retail and Professional cash demand for securities visualized in open-end mutual fund (including ETF) net flow metadata.
s3://valuevector2 - Professional market demand for securities visualized in portfolio asset, price, and share data filings submissions by investment management companies.
Continuous updates of portfolio ownership levels and mutual fund net flows are aggregated and blended for analytics. Data visualizations describe how market demand sentiment is changing dimensionally; for sector-specific and security-specific assets: to label, train, learn, and discover asset and price inferences - to train AI with three relevant variables (asks) about the changing values:
How much? How many? How fast?
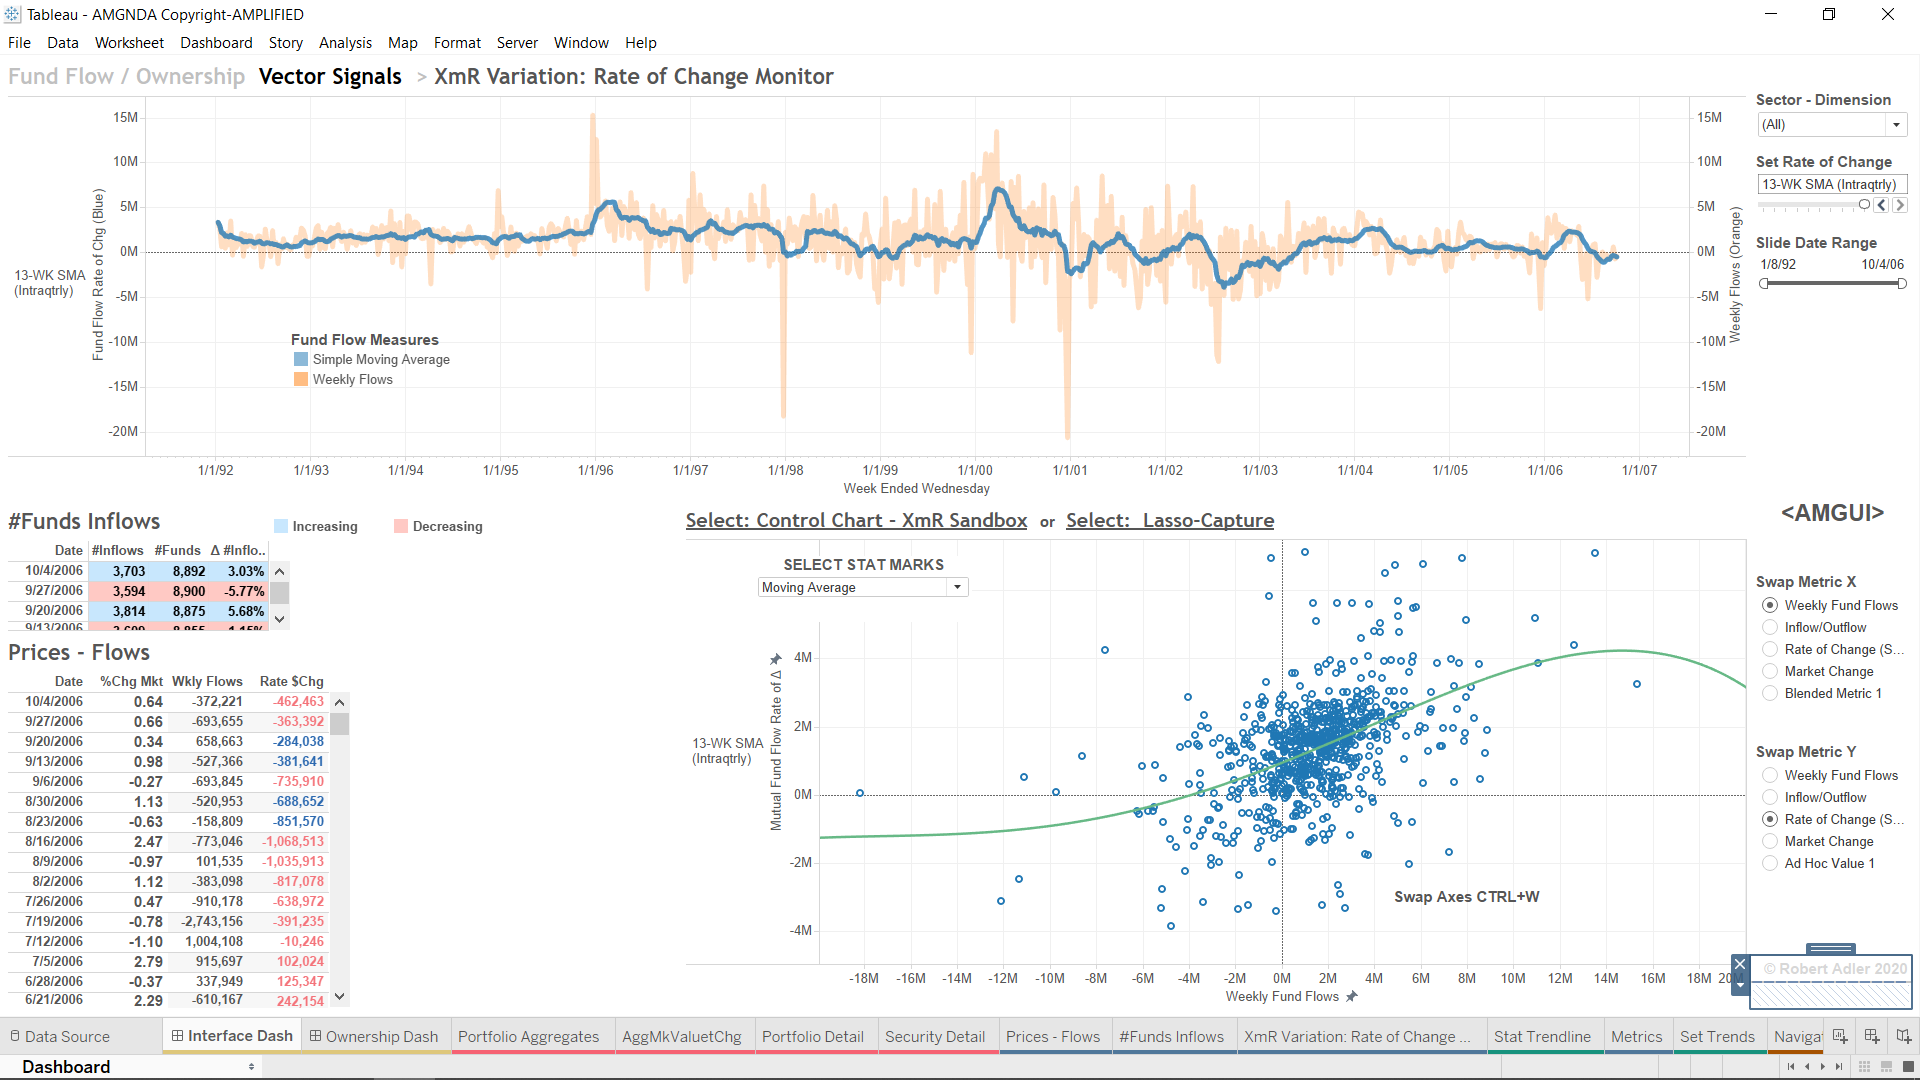
The interactive dashboards inform and empower user control of how the changes appear in the visual interface. The dashboard monitor displays activity with user-defined parameters to point and set alerts for any level of detail: eg Dashboard Template (Tableau 2025x)
Interactive research produces unique and personal visualizations of the nature of changing information - with shared perspectives: to identify actionable opportunities from signals of changing sentiment.
The virtual platform data reside in local, hybrid, or cloud object storage and connect to continuous market asset and price information that is reported as mutual fund (Incl ETF) net investor flow integer metadata, and security share and asset level data filed by professional managers. The updated data narrative is sourced, visualized, and sustained (embedded) within the dashboard view. The interface blends disparate data sources; extending and augmenting sentiment research to fundamental, technical, and ad hoc calculated values in non-Financial verticals (media, tech, social, rideshare, determinative....), where understanding manifest truthful data at the forefront of change is also relevant and meaningful.
© 2025 Robert Adler TXu 2-489-251 Amplified, All Rights Reserved